EX-99.1
Published on November 25, 2022
Exhibit 99.1

HPS Corporate Lending Fund 2022 Q3 Investor Update Call Transcript and Presentation
CAUTIONARY NOTE REGARDING FORWARD-LOOKING STATEMENTS
This transcript contains, and the attached presentation may contain, forward-looking statements about the business of HPS Corporate Lending Fund (the Fund), including, in particular, statements about the Funds plans, strategies and objectives. You can generally identify forward-looking statements by the Funds use of forward-looking terminology such as may, will, expect, intend, anticipate, estimate, believe, continue or other similar words. These statements include the Funds plans and objectives for future operations, including plans and objectives relating to future growth, availability of funds and dividends/earnings, and are based on current expectations that involve numerous risks and uncertainties. Assumptions relating to these statements involve judgments with respect to, among other things, future economic, competitive and market conditions and future business decisions, all of which are difficult or impossible to accurately predict and many of which are beyond the Funds control. Although the Fund believes the assumptions underlying the forward-looking statements, and the forward-looking statements themselves, are reasonable, any of the assumptions could be inaccurate and, therefore, there can be no assurance that these forward-looking statements will prove to be accurate and the Funds actual results, performance and achievements may be materially different from that expressed or implied by these forward-looking statements. In light of the significant uncertainties inherent in these forward looking statements, the inclusion of this information should not be regarded as a representation by the Fund or any other person that the Funds objectives and plans, which the Fund considers to be reasonable, will be achieved.
You should carefully review the Risk Factors section of the Funds prospectus and any updates in its quarterly reports on Form 10-Q for a discussion of the risks and uncertainties that the Fund believes are material to its business, operating results, prospects and financial condition. Except as otherwise required by federal securities laws, the Fund does not undertake to publicly update or revise any forward-looking statements, whether as a result of new information, future events or otherwise.
Page 1
HPS Investment Partners, LLC | 40 West 57th Street, 33rd Floor, New York, NY 10019
| Moderator: | Thank you to all who are joining us today. Im excited to be joined by Michael Patterson, Chief Executive Officer for HLEND and Grishma Parekh, Co-Head of North America Core Senior Lending and trustee for HLEND. | |
| Today, were going to be having a conversation with HLEND discussing the portfolio as well as reviewing drivers of performance this year. Now, as a reminder, HLEND broke escrow earlier this year and has raised approximately $3.3 billion to date. | ||
| At the end of the call, Michael and Grishma will be available to answer any questions that you may have. And with that, Im going to turn it over to Mike to get started. | ||
| Michael Patterson: | Thank you and thank you everyone for joining. Weve organized todays discussion into three main sections. | |
| The first is discussing the financial highlights of HLEND as a vehicle. The second, some comments on portfolio composition and portfolio underlying portfolio fundamental performance. And then the third, and I think particularly important, in todays environment, a discussion of the current market opportunity. | ||
| Im joined today by Grishma Parekh, fellow trustee of HLEND, who will help me respond to any additional questions at the end of it if folks have them. | ||
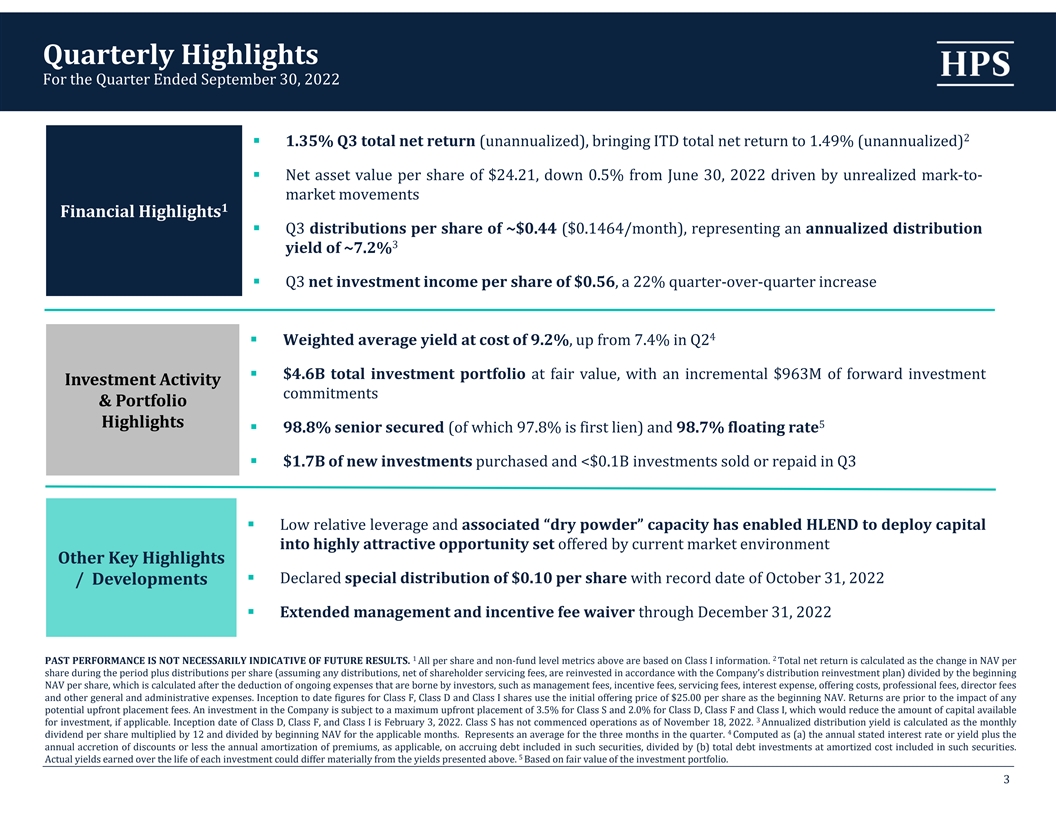
| So first on Page 3 of the presentation, the quarterly highlights. The total return unannualized of HLEND in Q3 was 1.35%. The inception to date, since we launched in the first quarter, is 1.49%, also unannualized. | ||
Page 2
HPS Investment Partners, LLC | 40 West 57th Street, 33rd Floor, New York, NY 10019
| The net asset value per share is $24.21. That is down 50 basis points from June 30. | ||
| Thats driven by unrealized mark to market movements. I think we take a lot of pride in marking our portfolio based on both the fundamentals of the underlying companies and movements in the public markets of equivalent assets. And so weve done that with this portfolio. | ||
| The third quarter distribution per share was 44 cents. Thats a little over 14 cents on a monthly basis. That represents an annualized distribution yield of 7.2%. | ||
| And the net investment income per share in Q3 was 56 cents. That is a a 22% increase quarter over quarter. | ||
| In the underlying portfolio, the weighted average yield at cost of the investment portfolio is 9.2%. That is up significantly from the same statistic in the second quarter. Thats driven both by an increase in base rates and an increase in spreads in the underlying portfolio. | ||
| There are $4.6 billion in total investments at fair value. We have an incremental $963 million of forward investment commitments. | ||
| I think what well see when we review quarter-over-quarter statistics in the portfolio is weve taken a conservative approach at the beginning of the year. The portfolio has been at less than our target leverage for all of its life so far. And I think that conservative approach is going to pay real dividends, pun intended, on a forward basis as were getting into an environment where capital is scarce and the dollars that we can invest are quite precious. | ||
Page 3
HPS Investment Partners, LLC | 40 West 57th Street, 33rd Floor, New York, NY 10019
| 98.8% of the portfolio is senior secured, 97.8% of that is first lien senior secured and 98.7% is floating rate. We made $1.7 billion of new investments in the quarter and just under $70 million of investments were sold or repaid either through amortization or in liquid portfolio sales and purchases in the third quarter. | ||
| Other key highlights in the quarter are we have low relative leverage. So we have significant dry powder capacity. | ||
| That enables us to be very active in todays investment environment and deploy capital at the point in the market that we think is particularly compelling which is today and certainly the next several quarters. I think that approach of being conservative when markets are hot and aggressive when capital is scarce is really going to differentiate portfolio performance over the course of the next year. | ||
| We did declare a special distribution of 10 cents per share at the end of October. That brings the annualized yield, if you include the base dividend, to about a 7.8% cash dividend yield for the portfolio. Weve also extended the management and incentive fee waiver through the end of 2022. | ||
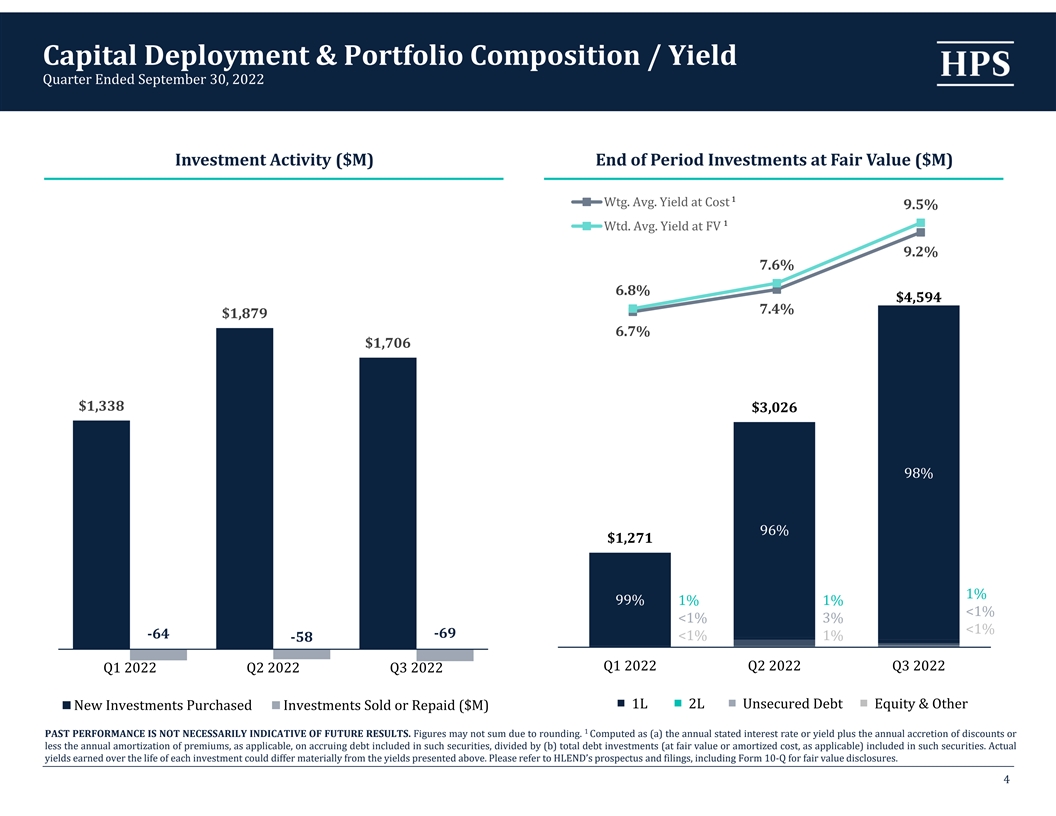
| On Page 4 of the presentation, this details the investment pace and portfolio yields. On a quarterly basis, investment pace accelerated in Q2 and Q3. And we were relatively conservative in Q1. | ||
| The yield on the portfolio as of September 30 was 9.2% at cost and 9.5% at fair value. The delta between those two, I think does show that we are actively marking the portfolio in a market where public market equivalents have traded down. | ||
| But that significant increase in yield, as I said, is both a function of wider spreads in todays market and significantly higher base rates. When we look at the base rate moves, most of our portfolio references the Secured Overnight Funding Rate, or SOFR. | ||
Page 4
HPS Investment Partners, LLC | 40 West 57th Street, 33rd Floor, New York, NY 10019
| SOFR at the end of Q2 on June 30, 2022 was 1.5%. SOFR at the end of Q3 was 2.98%. Although it feels like weve all been living in a macro environment of higher rates for years at this point, the reality is the underlying portfolio has just started to experience the benefits of significantly higher rates. | ||
| And, if we look at the forward curve which is the best predictor although not a particularly accurate one of where rates will be long term, we think at these levels obviously the elevated portfolio yield should be consistent on a go forward basis. | ||
| So now shifting to the underlying portfolio. If we look at the asset mix, we have concentrated our investing efforts at the top of the corporate capital structure. 98% of the assets that we have invested in are first lien senior secured, so the very top of the corporate capital structure. | ||
| We do maintain a portfolio of first lien and second lien and even some liquid unsecured bonds. 19% of the portfolio is in our liquid category and 81% is the private or illiquid category. And that liquid category will include a mix of first lien, second liens and even liquid unsecured bonds. | ||
| Weve seen a significant pickup obviously in yields of the floating rate portion of both our private and our liquid book. We will continue to optimize risk adjusted returns in the liquid book as that market, as explained on subsequent pages, has been highly volatile and prices have changed, and risk adjusted returns will change. So thats a constant focus to try to optimize on the risk adjusted returns while staying liquid in that bucket. | ||
Page 5
HPS Investment Partners, LLC | 40 West 57th Street, 33rd Floor, New York, NY 10019
| As of September 30, 2022, 98% is first lien, 99% of floating rate. And as of September 30, 2022, 0% of the book is on non-accrual. So one observation is that frankly weve seen fewer effects on portfolio fundamentals than perhaps wed all expect given the publicity around macroeconomic challenges. | ||
| I think my general comment on what were observing at the underlying company level is that performance has been fundamentally stable despite macro challenges. We are laser focused on the effects of wage pressure, supply chain and interest rates at underlying portfolio companies. | ||
| But when we look at fundamental performance, these companies have been successful passing through costs and disruptions to their customers. As I just stated the effects of interest rates on free cash flow that is really a forward-looking concern. | ||
| We remain highly vigilant about how that will affect existing capital that weve invested. And our underwriting assumption is that growth will slow and margins will compress. So were being very conservative in how much well lend to a company today, but weve not seen systematic effects on the portfolio yet. | ||
| If you look at where weve invested from a scale perspective the weighted average EBITDA of a company is $165 million. I think that is firmly at the upper end of the direct lending market. That is part of our risk mitigation strategy. | ||
| We believe that, if you dont have to sacrifice return or you dont have to take additional risk, lending to a company with north of a $100 million of EBITDA, or in our case $165 million on average, is significantly less risky than lending to smaller companies. | ||
Page 6
HPS Investment Partners, LLC | 40 West 57th Street, 33rd Floor, New York, NY 10019
| Those companies historically, when things are difficult, they have many more options to ultimately pay back their lenders. So thats a key part of our risk mitigation strategy. And again, we believe we dont sacrifice anything from a return perspective. | ||
| The weighted average loan to value in the portfolio, which we think is the best summary statistic from a risk perspective, is 42%. So, value of a company could compress really dramatically. And we feel like the loans would still have very significant value coverage. | ||
| On Page 6, some incremental portfolio detail. If you look at our industry mix software and computer services is 16%, and, healthcare is 14%. | ||
| Those are typical defensive industries where revenue in particular has proven itself to be highly defensive in challenging macroeconomic environments. That is by design. | ||
| Industrial business support services, again, those are service based businesses where we feel like the margins are variable and the ability to flex the cost base up and down has really been proven over time. But I think the more significant point is theres no significant concentration across any industry. And that is also by design. The aim is to develop a diversified portfolio that is defensive across multiple different macroeconomic environments. | ||
| Our largest positions, if you look at them today when our leverage is significantly below target, we have the largest position just north of 3% of total assets. There are 184 total portfolio companies in the portfolio. | ||
Page 7
HPS Investment Partners, LLC | 40 West 57th Street, 33rd Floor, New York, NY 10019
| On Page 7, the net asset value, bridge dollar per share. The net investment income, as we said of the portfolio, was 56 cents on a per-share basis. The distribution in Q3 was 44 cents. So note that our investment income exceeded our standard distribution by 25%, hence the special dividend on October 31 that the trustees approved. | ||
| And then the realized and unrealized loss of 23 cents per share. That is the one that I pointed out on my initial remarks is an effect of actively marking the book from a mark to market perspective. | ||
| So we originate at a spread above the average spread of traded syndicated loans. If the traded syndicated loan market significantly reprices, as it has over the course of Q2 and a little bit in Q3 as well, we will flow through those effects of public market changes in prices into our portfolio. So youll see those are unrealized mark to market losses. Thats not a comment about actual credit losses in the portfolio. | ||
| Finally, on Page 8, this is a more detailed walk on a quarter-by-quarter basis across the financial performance of HLEND. Ill point out a couple specific results here. | ||
| In the third line on the per-share data you can see the effects of unrealized mark-to-market effects in the portfolio as public market broadly syndicated loans have traded down through the course of 2022. Again, those are not realized credit losses, but that is evidence of us actively marking the book which I think is appropriate. | ||
| If you look at the balance sheet and the ending debt to equity, which is the fourth row under the balance sheet, our target leverage is one to one. Weve been very conservative in the start of the portfolio, starting with high quality assets and not relying on leverage to drive returns. We now think given how attractive the investment market is that were going to be proceeding closer to the target leverage as we invest aggressively into this market. | ||
Page 8
HPS Investment Partners, LLC | 40 West 57th Street, 33rd Floor, New York, NY 10019
| The annualized dividend yield is 7.2% at the end of this quarter. And our dividend coverage is 125%. And finally, if you include the effects of the special dividend, as discussed, thats about 7.8%. | ||
| So, shifting gears and talking about the current market environment, before I get into the pages, I think Ill pause just for a bit of an overview. While the invested portfolio has not displayed systematic weakening fundamentals, the market dynamics for new investments have remained exceptionally attractive in this market. | ||
| That is a result of a combination of deteriorating trading levels in the public loan market at the same time that we see scarcer capacity in the private loan market. And that has created a really compelling kind of supply demand dynamic for private credit, as compelling as we have ever seen. | ||
| Leverage loan issuance was down 69% year to date but its down 86% quarter over quarter when we look at Q3. And theres still a fairly significant overhang from underwriting losses at banks. | ||
| And thats really closed off market access for non-investment grade issuers to all but the highest rated credits. Certainly the double B market is still open. But if youre a single B borrower, there has not been a more challenging time to borrow capital in the last decade. | ||
Page 9
HPS Investment Partners, LLC | 40 West 57th Street, 33rd Floor, New York, NY 10019
| Meanwhile, some of our largest competitors, in the private credit space, have slashed their hold sizes for a given deal. Competitors that were committing $1 billion to a single investment are now committing $200 million to investments of higher yield and similar quality. | ||
| So as a result, today in the real core of the private credit market, which is leveraged buyout lending, and this is in the large cap area, we see spreads wider, 100 basis points plus. We see, obviously, base rates are north of 300 basis points wide relative to where we started the year. | ||
| And the ability to command additional upfront fees is on the table in virtually every deal. So that is a dramatic change from the end of 2021, one where all the value accrues to lenders like HLEND and investors like you. And were incredibly excited about it. | ||
| We do find that capital is the most scarce at the upper end of the market. And thats despite the relationship between risk and return, at the upper end of the market that we talked about earlier, we actually see the ability to command a premium of 25 or 50 basis points versus the low end of the market. | ||
| And we think that dynamic reflects capital availability, but it actually inverts the relationship between risk and return in our opinion. So thats the overview. I think in my career Ive never seen a market more compelling from a direct lending perspective than the one were facing today. | ||
| So looking on Page 10, Page 10 is a chart of the LSTA Loan Syndications and Trading Association B Rated loan Index. This is the average bid price. Today its about 92 cents on the dollar. | ||
| Weve seen that actually stable over the course of the last quarter, but single B issuance as you see on Page 11, has plunged. So there is very little issuance in the leverage loan market, and Page 11 is the entire leverage loan market and the entire high yield market and virtually all of that issuance is the higher end, the double B side. | ||
Page 10
HPS Investment Partners, LLC | 40 West 57th Street, 33rd Floor, New York, NY 10019
| A double B issuer today can issue a loan at LIBOR plus 325 at 98 or 99. And the single B issuer pretty much cant find anyone other than the private credit markets to embrace new issue. And thats despite the risk profile. | ||
| So the public markets arent receptive to new issue. Banks are focused on repairing their own balance sheets after a period of really aggressive underwriting and now will realize losses when they try to sell the likes of the | ||
| Citrix and the Twitter, very, very high profile, large underwrites. | ||
| Theyre still working through that and are not active in the new issue space. And that really opens up the opportunity for private credit, and in particular, private credit at the upper end of the market to drive terms. | ||
| And what youve seen on Page 12. 53% of the dollars deployed in private credit in 2022 has been at the upper end of the market. And obviously one $2 billion deal is equal to ten $200 million deals. So, this is by transaction value not by deal count, but weve never seen a period in history where private credit is more needed and more active at the upper end of the market. | ||
| To be a leader in those deals requires scale. Thats something HLEND and HPS more broadly brings to the table. And it also allows us to drive terms and control risk. So thats our focus today. | ||
| That concludes our prepared remarks. So moderator, should we open it up for the initial questions? | ||
Page 11
HPS Investment Partners, LLC | 40 West 57th Street, 33rd Floor, New York, NY 10019
| Moderator: | Yes, absolutely Michael. We can just get started with few questions that weve already received. So can you actually discuss what causes the movement in the funds NAV? | |
| Michael Patterson: | Sure. I mean the primary movement in the funds NAV is tied directly to mark-to-market based on valuations. Obviously, the funds NAV is investment income net of distributions. | |
| Those are fairly closely matched, although theres usually a little excess in terms of the funds investment income versus the distribution. And then mark-to-market considerations. | ||
| And the mark to market considers two things, one fundamental performance in each underlying company. So we go through a fairly exhaustive process on a company-by-company level. | ||
| We typically get monthly financials sometimes quarterly financials on the company. So once we collect those and have interactions with the management teams, to be sure we understand both what happened and what we think is going to happen on a company by company basis, if there are fundamental issues first and foremost those fundamental issues will flow through our valuation methodology. | ||
| If a companys leverage has increased significantly or if companies in that industry have valuations that have contracted because there are macro concerns about everyone in that industrys performance on a go forward basis, thatll increase the loan to value that we assume for that specific name. And an increased loan to value means that given the spread on the loan wont necessarily change just because the loan to value change. | ||
Page 12
HPS Investment Partners, LLC | 40 West 57th Street, 33rd Floor, New York, NY 10019
| That means that, that individual name will be marked down to give an appropriate risk adjusted return given updated financials. So thats point number one. | ||
| My comments on fundamentals were if were talking about what weve seen in NAV changes, the 50 basis point change in NAV for example, over the course of the last couple quarters, that is not the primary driver. The primary driver has been the loan market. And I think in Page 10, you can see the loan market has traded down 800 basis points. | ||
| So that has re-priced the kind of public market equivalents single B lending. And, we think its appropriate and we take great pride in considering that and flowing that through. | ||
| So its not on a dollar-for-dollar basis when our loans started at similar risk profiles and much higher spreads. But we think we should still be commanding a premium on a yield basis on our loans compared to the public market. So that causes us to pull down the average price of a loan. | ||
| So if we originated a loan at 98 cents on the dollar, that means a 200 basis point upfront fee. Today that loan might be at 96.5 or 96 just to make sure that were maintaining an appropriate spread above public market equivalents for the average loan. | ||
| So its unrealized. That loan we still expect it to be repaid at par, the theoretical loan that we were just discussing. But between here and there when public market equivalents trade down we flow unrealized markdowns through the NAV. | ||
Page 13
HPS Investment Partners, LLC | 40 West 57th Street, 33rd Floor, New York, NY 10019
| Moderator: | Thanks, Michael. Next question about the distribution yield. So can you discuss what your expectations are for the distribution yield in the current interest rate environment? | |
| Michael Patterson: | Sure. And yes obviously interest rates have gone up somewhat dramatically over the course of the short life of HLEND so far. So were currently at a 7.2% yield. The back of the envelope dividend math, the asset-level yield at the end of Q3, was 9.5% as we discussed. Our target leverage is one to one. | |
| If you deduct interest expense and fees and expenses of running the vehicle that gives us a dividend yield in the low nines. So we would expect the dividend to be in that neighborhood in this interest rate environment. | ||
| Moderator: | And I think as we continue to talk about distributions and dividends. So, in addition to the monthly based distribution thats typically paid, you mentioned that there was a special distribution for shareholders on record as of October 31. Are there any plans in the future for another special distribution? | |
| Grishma Parekh: | Its Grishma, I figured Id chime in here. So, I think the way that our investors should think about the special dividend is as a matter of course we would expect to pay out substantially all of the income that weve generated during the year. | |
| Thats consistent with RIC guidelines. Its also to reduce or eliminate excise tax. And its meant to enhance the realized cash distribution that we are providing to our investors. So you should expect us to make a special dividend certainly each December, if not more often, in order to pay out the majority of any remaining net income in excess of distributions that weve paid on a year-to-date basis. | ||
Page 14
HPS Investment Partners, LLC | 40 West 57th Street, 33rd Floor, New York, NY 10019
| Mike talked about this, and you may have seen, but the HLEND board did declare the special dividend of 10 cents per share on October 31. That will get paid to all investors of record at the end of November. | ||
| And our expectations are that we should be in a position to distribute another special dividend, and we are in discussions with the board on that prior to year-end in conjunction with our regular dividend. And, going forward we are going to be engaging in regular dialogues with our board in order to be able to provide special dividends at the end of the year and then intermittently as we see best fit. | ||
| Moderator: | Thank you, Grishma. Can HPS actually just walk us through some of the sample terms that you were first getting when you first started this fund, compared to today? | |
| Grishma Parekh: | Yes. Im happy to. And I will talk on sort of no specific company named basis. But we, as you see in our portfolio construction, weve gravitated the portfolio towards businesses that are in what we view as defensive recession resilient sectors. | |
| So it should come as no surprise that our top sectors are healthcare, software, financials. And we have team heads, both in the public and private side, that allow us to be able to conduct due diligence on those investments with a forward-thinking mentality. | ||
| And so software has been an area that we have liked as a firm for quite some time. We saw the advent of particularly interesting software opportunities really in 2021. | ||
| And this was driven by a trend that Mike alluded to which was the private markets seeing the opportunity to finance ever bigger businesses, and we really have since | ||
Page 15
HPS Investment Partners, LLC | 40 West 57th Street, 33rd Floor, New York, NY 10019
| the start of the asset class. And that really was a trend that was led by private equity firms acquiring very high quality software businesses. And that continued into 2022. | ||
| So we had an opportunity to lead and finance a go-private transaction of a large public software business. This is software that is longstanding. These are companies that have ten plus years of operating history. | ||
| They are providing software that is embedded within their customers infrastructure. So its incredibly sticky. They have long term contracted revenues, so you have a fair amount of visibility. And these are businesses that are trading oftentimes in excess of 20 times their earnings. | ||
| So this is an opportunity to work with one of the top private equity firms in the industry that acquire software businesses. They were acquiring this company for roughly six to seven times recurring revenue. It was a close to $10 billion valuation as a multi-billion dollar financing. | ||
| That transaction was structured in Q1 really before we saw a lot of the volatility in the public markets. We had the opportunity to finance an equivalent quality business six months later, six or seven months later, very similar enterprise value $8 billion to $10 billion, very similar in terms of valuation, actually higher valuation eight to nine times recurring revenue, multi-billion dollar financing. | ||
| And you had roughly one turn less leverage, you had 75 basis points more spread, 100 basis points more in upfront fees, an extra year of call protection and a document that if you had to quantify it was somewhere between 25% to 30% more restrictive in terms of the basket capacity that was available. | ||
Page 16
HPS Investment Partners, LLC | 40 West 57th Street, 33rd Floor, New York, NY 10019
| And that is almost a direct reflection of the shift in the market. And that is driven by two things, which is, companies no longer had a viable public credit market alternative when they were competing on the financing. | ||
| The only viable market that businesses, of really any scale had, was the private markets. So we really eliminated one competitive element of the way that we were negotiating on our transactions. | ||
| And then the second, very unique dynamic that exists in todays market, is the larger the business the better the pricing and the better the terms that we can command which is sort of perverse in what you would normally think about bigger businesses, more stable should be lower risk, and thus you should be able to price those transactions lower. | ||
| And because capital is so scarce at the market. In the market today, the larger the financing the more of a premium that we can command to it. So ultimately you had two very, very similar businesses where there was almost a 250 basis points uplift in the total return for a transaction that was structured and financed six months later driven largely by the shift in the market. | ||
| Michael Patterson: | This is Mike again, thanks Grishma. Thats a good apples to apples comparison of private credit to private credit. An even more dramatic one. There was a recent LBO, and I will do the same, and it will remain nameless, but Ill describe it. | |
| An industrial services company with a lot of recurring revenue being purchased for $14 billion that has $1.1 billion of EBITDA borrowing about well right at five times. So being purchased for just under 14 and levered at five times, so again, 40% loan to value. | ||
Page 17
HPS Investment Partners, LLC | 40 West 57th Street, 33rd Floor, New York, NY 10019
| That company never wouldve been a borrower in the private credit markets previously. And because single B underwriting is so scarce today the comparison there is that in January of 2022 that wouldve been a LIBOR plus 350 covenant light, probably not borrowing five times, maybe borrowing more than five times at that pricing. | ||
| Today, and this is an investment that we participated in, its a massive funding. So, we and others participated in it, but they had to come to the private credit markets. And that was priced at LIBOR plus 675; LIBOR plus 675 at 98. | ||
| So it went from, if you want to do the comparison of the equity to returns to the credit returns they wouldve borrowed at LIBOR plus 350-ish at 30 basis point LIBOR in January, so well call that a roughly 4% cost of funding. And now theyre borrowing at SOFR plus 675 at 98 with SOFR being 4%, so its north of an 11% cost of capital just for the senior security piece. | ||
| But I highlight that because its not just where would a private credit loan in January price and where would a private credit loan in November price. As Grishma said I think leverage is lower. | ||
| Thats an important piece of it. Leverage for that private credit piece is a half turn maybe a full turn lower. So its not that risk is higher and pricing is higher, leverage is actually lower and the pricing is higher. I think spreads are higher by 100, 150 basis points, and upfront fees are 100 basis points wider. | ||
| There are a significant number of borrowers that wouldve been public credit borrowers paying 4% for a covenant light first lien that are now paying 11% plus for a private credit loan at a similar leverage level to where a publicly traded loan wouldve been. So its actually a huge shift; not just that private credit spreads are | ||
Page 18
HPS Investment Partners, LLC | 40 West 57th Street, 33rd Floor, New York, NY 10019
| wider, but there are companies that never wouldve been in the private credit borrower universe who are borrowing at private credit. | ||
| And I think from a quality perspective thats one of the most exciting things happening in the market today is its not just the history of private credit. And if we go back a decade ago, $25 million EBITDA companies had to borrow from private credit because they didnt have efficient access to the capital markets. | ||
| Now were talking about $1 billion EBITDA companies that dont have efficient access to the capital markets and therefore are coming to the private credit markets and paying significant premiums over where $25 million EBITDA companies borrowed a year ago. | ||
| Moderator: | Michael and Grishma thank you so much for going through all these questions. With that were going to conclude todays call. Thank you, the rest of the HPS team, for your insights and ongoing work. | |
| Michael Patterson: | We went through a lot of data and several pages, but I just wanted to take a moment to bring it together. | |
| I think one, first and foremost, we are, as an investment firm, very happy with HLENDs performance to date. We think weve navigated really challenging times in a way where when being conservative wasnt obvious we were. | ||
| And it put us in a position to take advantage of what is, in my personal opinion, the most attractive private credit market we have faced in my career in private credit. So were proud of that and excited about the future. | ||
Page 19
HPS Investment Partners, LLC | 40 West 57th Street, 33rd Floor, New York, NY 10019
| HLEND delivered an annualized yield of 7.2% to date. It should be high sevens with the special dividend declared in October. And at current rates and spreads, the portfolio can support dividend yields of north of 9% at one times leverage. | ||
| Importantly the health of the dollars in the ground thats paramount. We feel good about it. Again, we were conservative in how we invested and that has positioned us to take advantage of todays market. | ||
| The moves in NAV are based on unrealized returns. I think its appropriate to mark the book when the public markets moved, and weve done that. And, we have low leverage that creates dry powder, and its left us, we think, uniquely positioned to capitalize on todays market so thank you. | ||
| Moderator: | Thank you. That concludes todays conference. Thank you for participating. You may disconnect at this time. | |
Page 20
HPS Investment Partners, LLC | 40 West 57th Street, 33rd Floor, New York, NY 10019
November 2022 HPS Corporate Lending Fund (“HLEND”) 2022 Q3 Investor Update Call 1
Important Disclosure Information This material is for information purposes only, is confidential and may not be reproduced or distributed except as otherwise provided herein. All information provided herein is as of the date set forth on the cover page (unless otherwise specified) and is subject to modification, change or supplement in the sole discretion of HPS Investment Partners, LLC (“HPS” or the “Adviser”) without notice to you. This information is neither complete nor exact and is provided solely as reference material with respect to HPS Corporate Lending Fund (“HLEND”) which is a non-exchange traded business development company (“BDC”). This material does not constitute a prospectus and must be read in conjunction with the HLEND prospectus in order to fully understand all the implications and risks of an investment in HLEND. This information should not be construed as legal, regulatory or tax advice. Investors should consult with their own advisors when considering an investment in any investment strategy. PASTPERFORMANCE IS NOT NECESSARILY INDICATIVE OF FUTURE RESULTS. This material contains information about HPS managed funds and general information about the market. You should not view information related to the past performance of HPS managed funds or information about the market, as indicative of future results, the achievement of which cannot be assured. Certain information contained in this material constitutes “forward looking statements,” which can be identified by the use of forward looking terminology such as “may,” “will,” “expect,” “ intend,” “anticipate,” “estimate,” “believe,” “continue” or other similar words, or the negatives thereof. These may include our financial projections and estimates and their underlying assumptions, statements about plans, objectives and expectations with respect to future operations, and statementsregarding future performance. Such forward-looking statements are inherently uncertain and there are or may be important factors that could cause actual outcomes or results to differ materially from those indicated in such statements. HLEND believes these factors include but are not limited to those described under the section entitled “Risk Factors” in its prospectus and any such updated factors included in its periodic filings with the Securities and Exchange Commission (the “SEC”) which will be accessible on the SEC's website at www.sec.gov. These factors should not be construed as exhaustive and should be read in conjunction with the other cautionary statements that are included in HLEND’s prospectus and other filings. Except as otherwise required by federal securities laws, we undertake no obligation to publicly update or revise any forward-looking statements, whether as a result of new information, future developments or otherwise. The contents of this material: (i) do not constitute an offer of securities or a solicitation of an offer to buy securities, (ii) offers can be made only by the respective offering documents which are available upon request, (iii) do not and cannot replace the offering documents and is qualified in its entirety by the offering documents, and (iv) may not be relied upon in making an investment decision related to any investment offering by the issuer of the securities, or any affiliate, or partner thereof ( Issuer ). All potential investors must read the offering documents and no person may invest without acknowledging receipt and complete review of the offering documents. With respect to any “targeted” goals outlined herein, these do not constitute a promise of performance, nor is there any assurance that the investment objectives of any program will be attained. All investments carry the risk of loss of some or all of the principal invested. These “targeted” factors are based upon reasonable assumptions more fully outlined in the offering documents for the respective investment opportunity. Consult the offering documents for investment conditions, risk factors, minimum requirements, fees and expenses and other pertinent information with respect to any investment. Past performance is no guarantee of future results. All information is subject to change. Thehypotheticalanalysisin this materialis intendedonlyfor illustrative purposes only and is based on certain assumptions. This analysis is not a promise, prediction or projection of future performance, but merely the result of applying formulas or mathematical methodologies to one or more sets of assumptions and variables. This material requires a great deal of subjective judgment and analysis, and there is no assurance that alternative modeling techniques would not be more appropriate or would not produce significantly different results. In addition, there can be no assurance that the methodology is free of errors that could result in material variations between the hypothetical results and the actual results. The methodology relies upon certain assumptions some of which are described above, but other unstated assumptions were also used. A relatively minor modification to an assumption may have a significant impact on the analytical results. In addition, events and conditions that are not assumed. 2
Quarterly Highlights For the Quarter Ended September 30, 2022 2 § 1.35%Q3totalnetreturn (unannualized), bringing ITD total net return to 1.49% (unannualized) § Net asset value per share of $24.21, down 0.5% from June 30, 2022 driven by unrealized mark-to- market movements 1 Financial Highlights § Q3distributionspershareof~$0.44 ($0.1464/month), representing anannualizeddistribution 3 yieldof~7.2% § Q3netinvestmentincomepershareof$0.56, a 22% quarter-over-quarter increase 4 § Weightedaverageyieldatcostof9.2%,up from 7.4% inQ2 § $4.6B total investment portfolio at fair value, with an incremental $963M of forward investment Investment Activity commitments & Portfolio Highlights 5 § 98.8%seniorsecured (of which 97.8% is first lien) and98.7%floatingrate § $1.7Bofnewinvestments purchased and <$0.1B investments sold or repaid in Q3 § Low relative leverage andassociated“drypowder”capacityhasenabledHLENDtodeploycapital intohighlyattractiveopportunityset offered by current market environment Other Key Highlights § Declaredspecialdistributionof$0.10pershare with record date of October 31, 2022 / Developments § Extendedmanagementandincentivefeewaiver through December 31, 2022 1 2 PASTPERFORMANCEISNOTNECESSARILYINDICATIVEOFFUTURERESULTS. All per share and non-fund level metrics above are based on Class I information. Total net return is calculated as the change in NAV per share during the period plus distributions per share (assuming any distributions, net of shareholder servicing fees, are reinvested in accordance with the Company’s distribution reinvestment plan) divided by the beginning NAV per share, which is calculated after the deduction of ongoing expenses that are borne by investors, such as management fees, incentive fees, servicing fees, interest expense, offering costs, professional fees, director fees and other general and administrative expenses. Inception to date figures for Class F, Class D and Class I shares use the initial offering price of $25.00 per share as the beginning NAV. Returns are prior to the impact of any potential upfront placement fees. An investment in the Company is subject to a maximum upfront placement of 3.5% for Class S and 2.0% for Class D, Class F and Class I, which would reduce the amount of capital available 3 for investment, if applicable. Inception date of Class D, Class F, and Class I is February 3, 2022. Class S has not commenced operations as of November 18, 2022. Annualized distribution yield is calculated as the monthly 4 dividend per share multiplied by 12 and divided by beginning NAV for the applicable months. Represents an average for the three months in the quarter. Computed as (a) the annual stated interest rate or yield plus the annual accretion of discounts or less the annual amortization of premiums, as applicable, on accruing debt included in such securities, divided by (b) total debt investments at amortized cost included in such securities. 5 Actual yields earned over the life of each investment could differ materially from the yields presented above. Based on fair value of the investment portfolio. 3
Capital Deployment & Portfolio Composition / Yield Quarter Ended September 30, 2022 Investment Activity ($M) End of Period Investments at Fair Value ($M) 1 Wtg. Avg. Yield at Cost 9.5% 10.0% 1 Wtd. Avg. Yield at FV 9.0% 9.2% 7.6% 8.0% 6.8% $4,594 7.0% 7.4% $1,879 6.7% 6.0% $1,706 5.0% 4.0% $1,338 $3,026 3.0% 2.0% 98% 1.0% 0.0% 96% $1,271 1% 99% 1% 1% <1% <1% 3% <1% ‐64‐69 <1% 1% ‐58 Q1 2022 Q2 2022 Q3 2022 Q1 2022 Q2 2022 Q3 2022 1L 2L Unsecured Debt Equity & Other New Investments Purchased Investments Sold or Repaid ($M) 1 PASTPERFORMANCEISNOTNECESSARILYINDICATIVEOFFUTURERESULTS. Figures may not sum due to rounding. Computed as (a) the annual stated interest rate or yield plus the annual accretion of discounts or less the annual amortization of premiums, as applicable, on accruing debt included in such securities, divided by (b) total debt investments (at fair value or amortized cost, as applicable) included in such securities. Actual yields earned over the life of each investment could differ materially from the yields presented above. Please refer to HLEND’s prospectus and filings, including Form 10-Q for fair value disclosures. 4
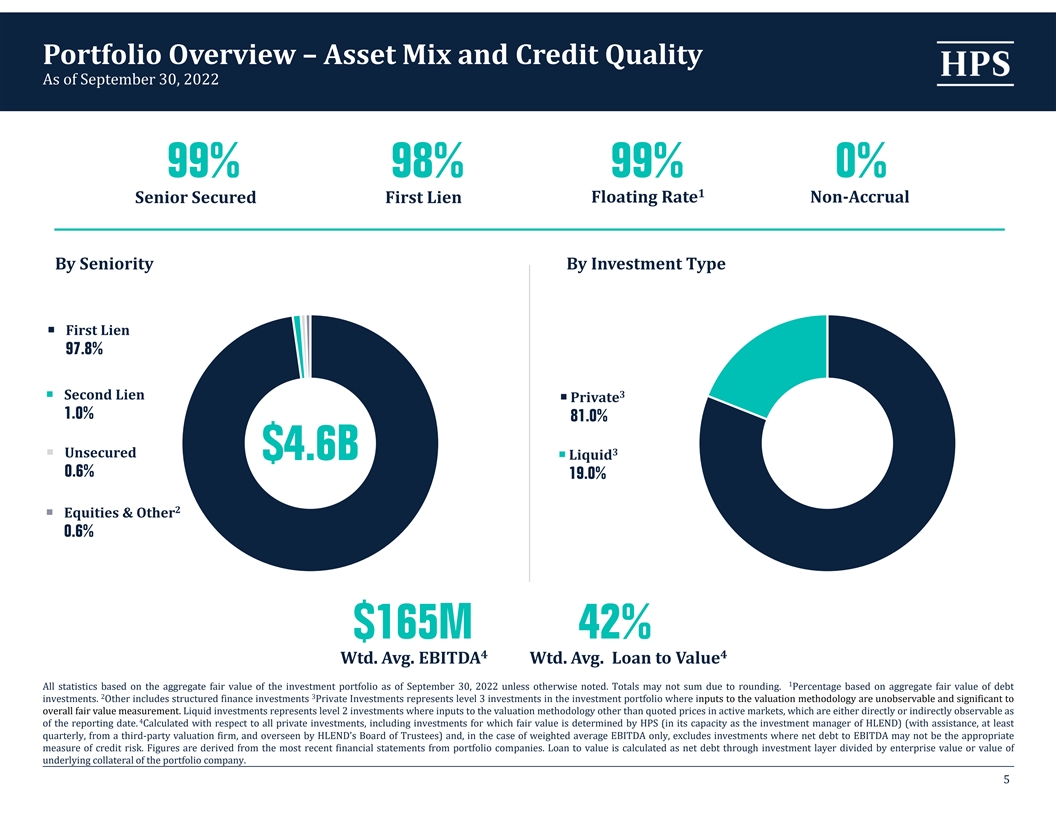
Portfolio Overview –Asset Mix and Credit Quality As of September 30, 2022 99% 98% 99% 0% 1 Floating Rate Non‐Accrual Senior Secured First Lien By Seniority By Investment Type First Lien 97.8% 3 Second Lien Private 1.0% 81.0% 3 Unsecured $4.6B Liquid 0.6% 19.0% 2 Equities & Other 0.6% $165M 42% 4 4 Wtd. Avg. EBITDA Wtd. Avg. Loan to Value 1 All statistics based on the aggregate fair value of the investment portfolio as of September 30, 2022 unless otherwise noted. Totals may not sum due to rounding. Percentage based on aggregate fair value of debt 2 3 investments. Other includes structured finance investments Private Investments represents level 3 investments in the investment portfolio where inputs to the valuation methodology are unobservable and significant to overall fair value measurement. Liquid investments represents level 2 investments where inputs to the valuation methodology other than quoted prices in active markets, which are either directly or indirectly observable as 4 of the reporting date. Calculated with respect to all private investments, including investments for which fair value is determined by HPS (in its capacity as the investment manager of HLEND) (with assistance, at least quarterly, from a third-party valuation firm, and overseen by HLEND’s Board of Trustees) and, in the case of weighted average EBITDA only, excludes investments where net debt to EBITDA may not be the appropriate measure of credit risk. Figures are derived from the most recent financial statements from portfolio companies. Loan to value is calculated as net debt through investment layer divided by enterprise value or value of underlying collateral of the portfolio company. 5
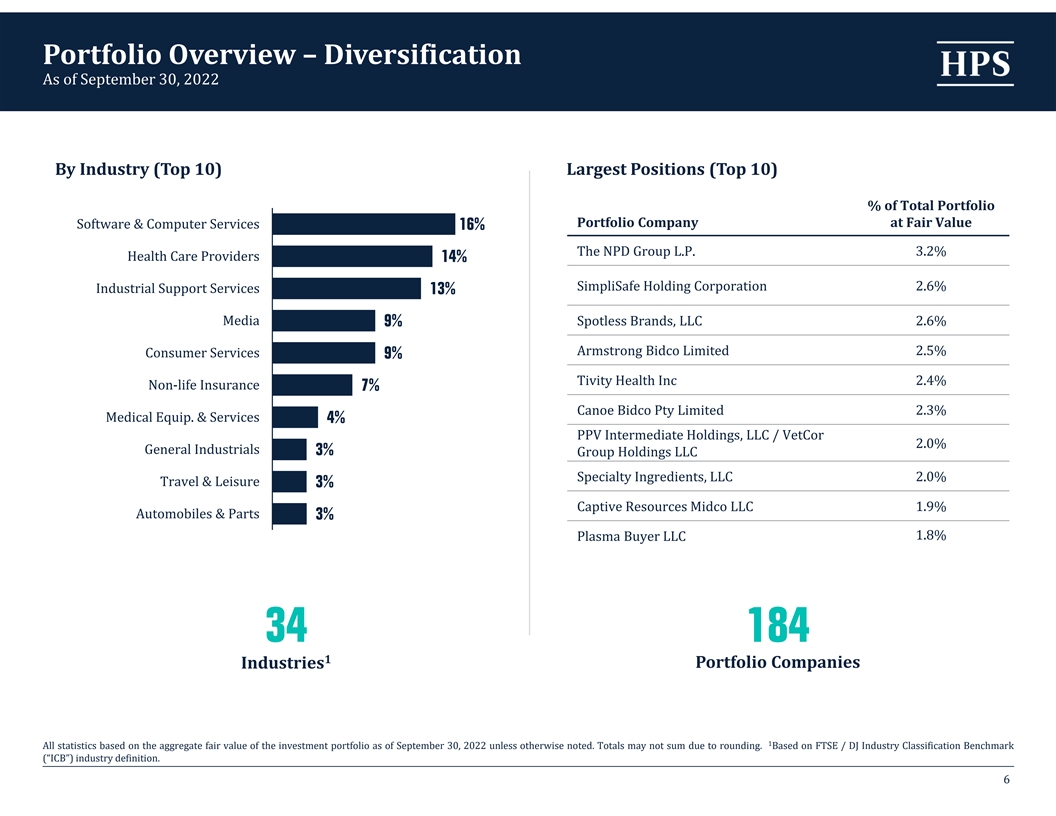
Portfolio Overview –Diversification As of September 30, 2022 By Industry (Top 10) Largest Positions (Top 10) % of Total Portfolio Portfolio Company at Fair Value Software & Computer Services 16% The NPD Group L.P. 3.2% Health Care Providers 14% SimpliSafe Holding Corporation 2.6% Industrial Support Services 13% Media Spotless Brands, LLC 2.6% 9% Armstrong Bidco Limited 2.5% Consumer Services 9% Tivity Health Inc 2.4% Non-life Insurance 7% Canoe Bidco Pty Limited 2.3% Medical Equip. & Services 4% PPV Intermediate Holdings, LLC / VetCor 2.0% General Industrials 3% Group Holdings LLC Specialty Ingredients, LLC 2.0% Travel & Leisure 3% 1.9% Captive Resources Midco LLC Automobiles & Parts 3% 1.8% Plasma Buyer LLC 34 184 1 Portfolio Companies Industries 1 All statistics based on the aggregate fair value of the investment portfolio as of September 30, 2022 unless otherwise noted. Totals may not sum due to rounding. Based on FTSE / DJ Industry Classification Benchmark (“ICB”) industry definition. 6
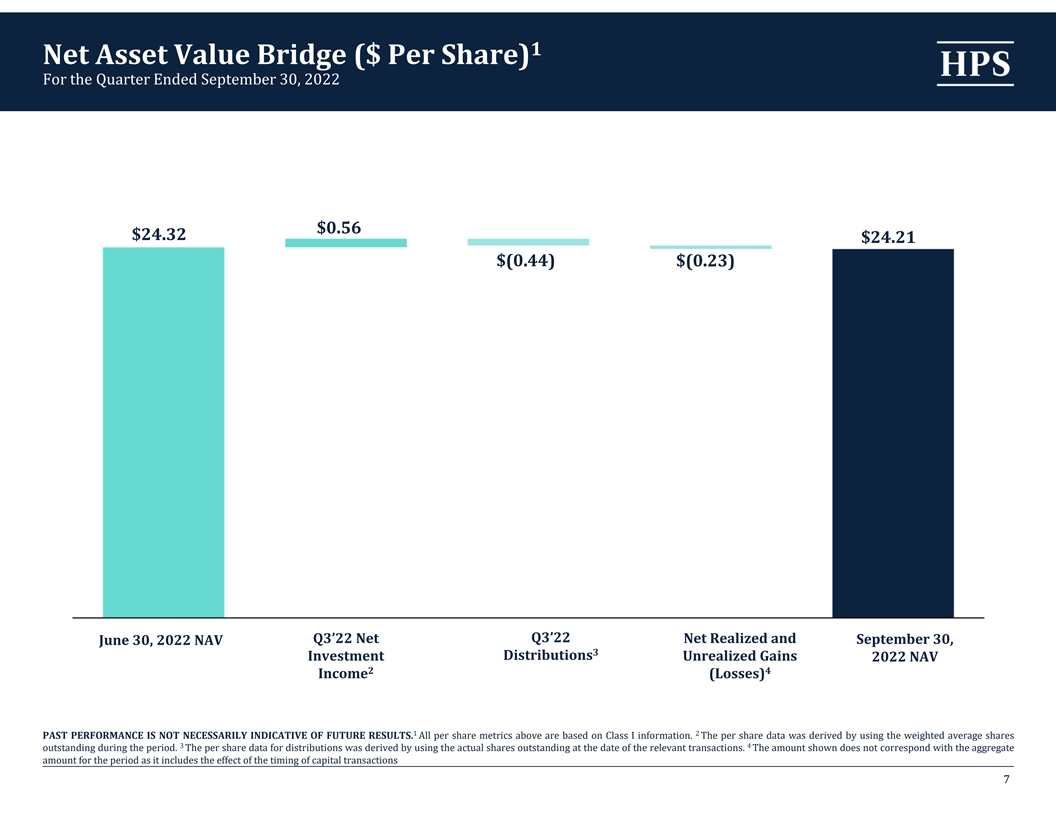
1 Net Asset Value Bridge ($ Per Share) For the Quarter Ended September 30, 2022 $0.56 $24.32 $24.21 $(0.44) $(0.23) Q3’22 Net Q3’22 Net Realized and September 30, June 30, 2022 NAV 3 Distributions Investment Unrealized Gains 2022 NAV 2 4 Income (Losses) 1 2 PAST PERFORMANCE IS NOT NECESSARILY INDICATIVE OF FUTURE RESULTS. All per share metrics above are based on Class I information. The per share data was derived by using the weighted average shares 3 4 outstanding during the period. The per share data for distributions was derived by using the actual shares outstanding at the date of the relevant transactions. The amount shown does not correspond with the aggregate amount for the period as it includes the effect of the timing of capital transactions 7
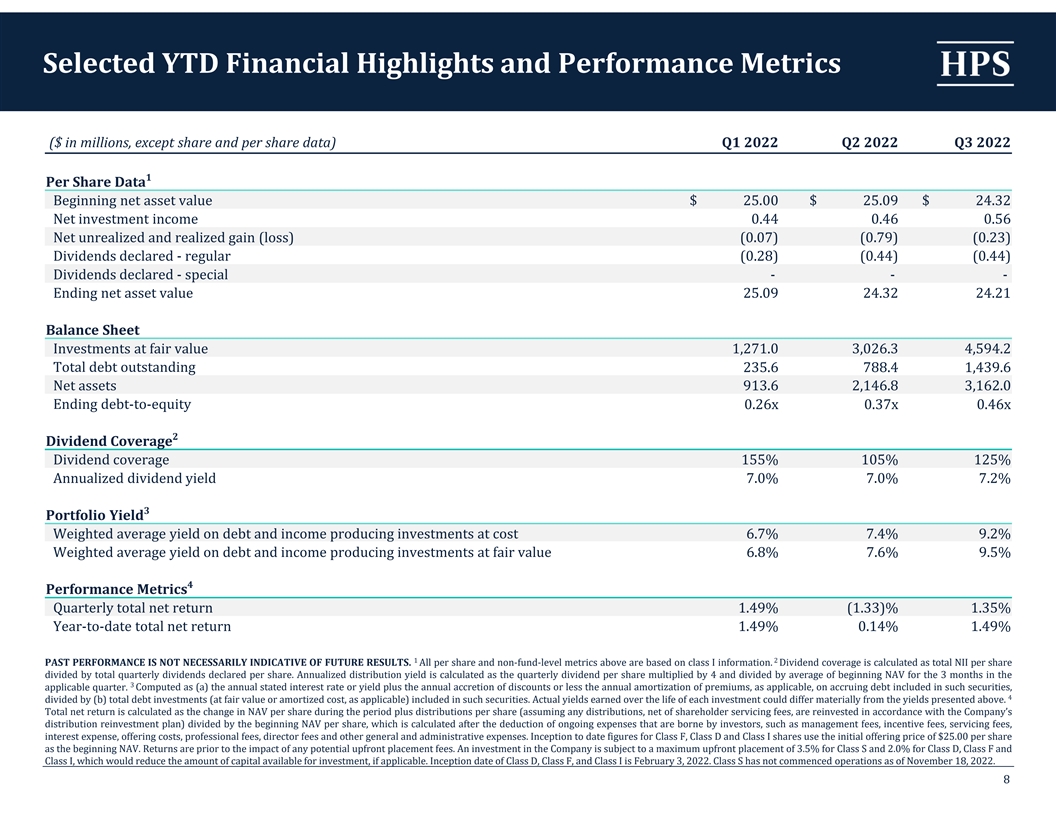
Selected YTD Financial Highlights and Performance Metrics ($ in millions, except share and per share data) Q1 2022 Q2 2022 Q3 2022 1 Per Share Data Beginning net asset value $ 25.00 $ 25.09 $ 24.32 Net investment income 0.44 0.46 0.56 Net unrealized and realized gain (loss) (0.07) (0.79) (0.23) Dividends declared - regular (0.28) (0.44) (0.44) Dividends declared - special -- - Ending net asset value 25.09 24.32 24.21 Balance Sheet Investments at fair value 1,271.0 3,026.3 4,594.2 Total debt outstanding 235.6 788.4 1,439.6 Net assets 913.6 2,146.8 3,162.0 Ending debt-to-equity 0.26x 0.37x 0.46x 2 Dividend Coverage Dividend coverage 155% 105% 125% Annualized dividend yield 7.0% 7.0% 7.2% 3 Portfolio Yield Weighted average yield on debt and income producing investments at cost 6.7% 7.4% 9.2% Weighted average yield on debt and income producing investments at fair value 6.8% 7.6% 9.5% 4 Performance Metrics Quarterly total net return 1.49% (1.33)% 1.35% Year-to-date total net return 1.49% 0.14% 1.49% 1 2 PASTPERFORMANCEISNOTNECESSARILYINDICATIVEOFFUTURERESULTS. All per share and non-fund-level metrics above are based on class I information. Dividend coverage is calculated as total NII per share divided by total quarterly dividends declared per share. Annualized distribution yield is calculated as the quarterly dividend per share multiplied by 4 and divided by average of beginning NAV for the 3 months in the 3 applicable quarter. Computed as (a) the annual stated interest rate or yield plus the annual accretion of discounts or less the annual amortization of premiums, as applicable, on accruing debt included in such securities, 4 divided by (b) total debt investments (at fair value or amortized cost, as applicable) included in such securities. Actual yields earned over the life of each investment could differ materially from the yields presented above. Total net return is calculated as the change in NAV per share during the period plus distributions per share (assuming any distributions, net of shareholder servicing fees, are reinvested in accordance with the Company’s distribution reinvestment plan) divided by the beginning NAV per share, which is calculated after the deduction of ongoing expenses that are borne by investors, such as management fees, incentive fees, servicing fees, interest expense, offering costs, professional fees, director fees and other general and administrative expenses. Inception to date figures for Class F, Class D and Class I shares use the initial offering price of $25.00 per share as the beginning NAV. Returns are prior to the impact of any potential upfront placement fees. An investment in the Company is subject to a maximum upfront placement of 3.5% for Class S and 2.0% for Class D, Class F and Class I, which would reduce the amount of capital available for investment, if applicable. Inception date of Class D, Class F, and Class I is February 3, 2022. Class S has not commenced operations as of November 18, 2022. 8

Current Market Environment 9
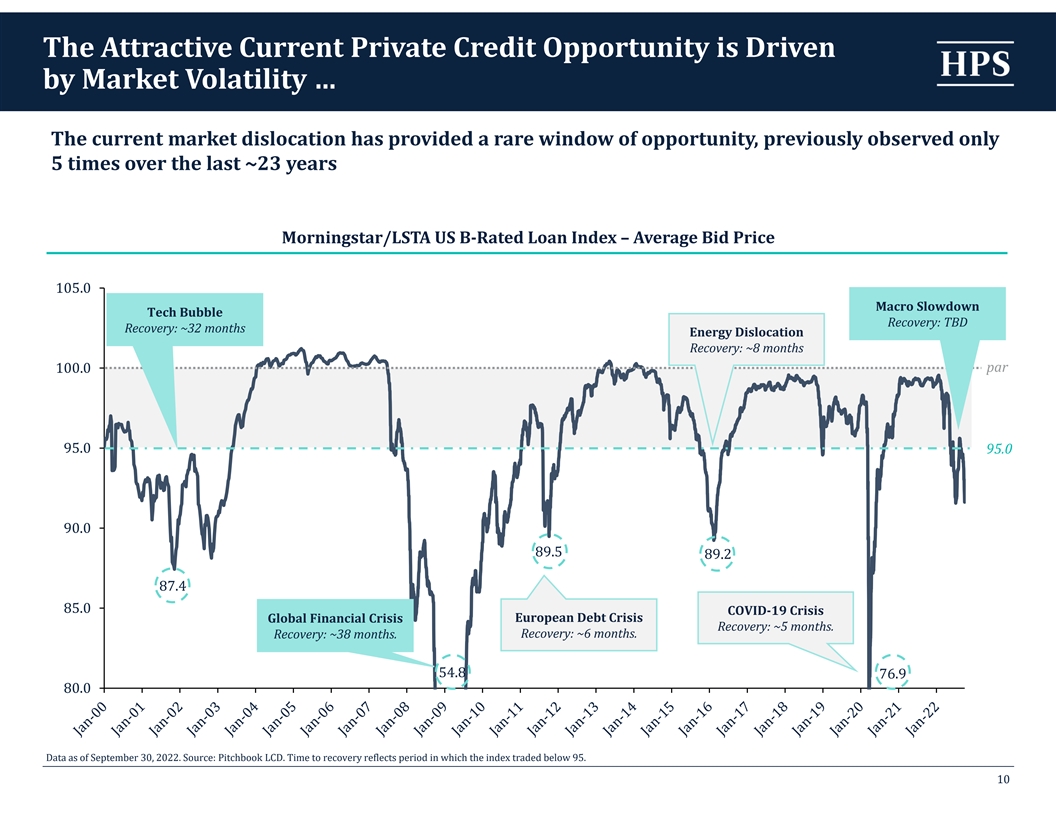
The Attractive Current Private Credit Opportunity is Driven by Market Volatility … The current market dislocation has provided a rare window of opportunity, previously observed only 5 times over the last ~23 years Morningstar/LSTA US B‐Rated Loan Index –Average Bid Price 105.0 Macro Slowdown Tech Bubble Recovery: TBD Recovery: ~32 months Energy Dislocation Recovery: ~8 months par 100.0 95.0 95.0 90.0 89.5 89.2 87.4 85.0 COVID‐19 Crisis Global Financial Crisis European Debt Crisis Recovery: ~5 months. Recovery: ~38 months. Recovery: ~6 months. 54.8 76.9 80.0 Data as of September 30, 2022. Source: Pitchbook LCD. Time to recovery reflects period in which the index traded below 95. 10
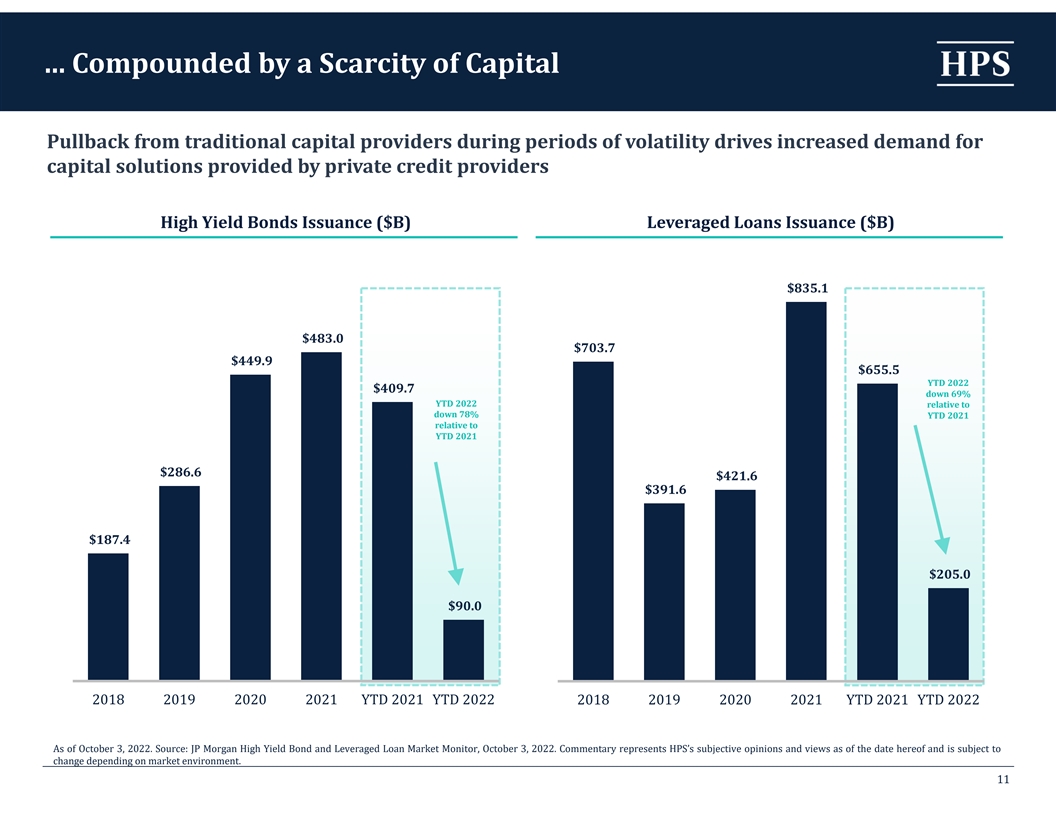
… Compounded by a Scarcity of Capital Pullback from traditional capital providers during periods of volatility drives increased demand for capital solutions provided by private credit providers High Yield Bonds Issuance ($B) Leveraged Loans Issuance ($B) $835.1 $483.0 $703.7 $449.9 $655.5 YTD 2022 $409.7 down 69% YTD 2022 relative to down 78% YTD 2021 relative to YTD 2021 $286.6 $421.6 $391.6 $187.4 $205.0 $90.0 2018 2019 2020 2021 YTD 2021 YTD 2022 2018 2019 2020 2021 YTD 2021 YTD 2022 As of October 3, 2022. Source: JP Morgan High Yield Bond and Leveraged Loan Market Monitor, October 3, 2022. Commentary represents HPS’s subjective opinions and views as of the date hereof and is subject to change depending on market environment. 11
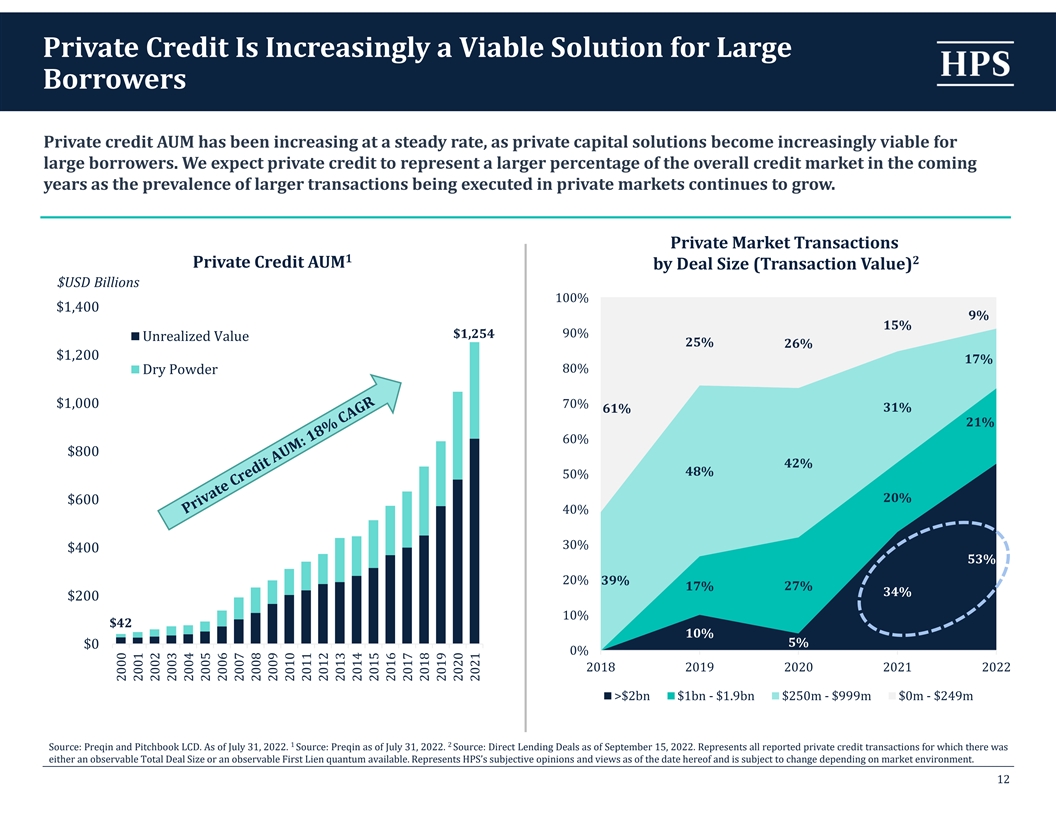
Private Credit Is Increasingly a Viable Solution for Large Borrowers Private credit AUM has been increasing at a steady rate, as private capital solutions become increasingly viable for large borrowers. We expect private credit to represent a larger percentage of the overall credit market in the coming years as the prevalence of larger transactions being executed in private markets continues to grow. Private Market Transactions 1 2 Private Credit AUM by Deal Size (Transaction Value) $USD Billions 100% $1,400 9% 15% 90% $1,254 Unrealized Value 25% 26% $1,200 17% 80% Dry Powder $1,000 70% 31% 61% 21% 60% $800 42% 48% 50% 20% $600 40% 30% $400 53% 20% 39% 17% 27% 34% $200 10% $42 10% 5% $0 0% 2018 2019 2020 2021 2022 >$2bn $1bn - $1.9bn $250m - $999m $0m - $249m 1 2 Source: Preqin and Pitchbook LCD. As of July 31, 2022. Source: Preqin as of July 31, 2022. Source: Direct Lending Deals as of September 15, 2022. Represents all reported private credit transactions for which there was either an observable Total Deal Size or an observable First Lien quantum available. Represents HPS’s subjective opinions and views as of the date hereof and is subject to change depending on market environment. 12 2000 2001 2002 2003 2004 2005 2006 2007 2008 2009 2010 2011 2012 2013 2014 2015 2016 2017 2018 2019 2020 2021

Important Disclosure Information 13
Important Disclosure Information SummaryofRiskFactors HPS Corporate Lending Fund (“HLEND”) is a non-exchange traded business development company (“BDC”) that invests at least 80% of its total assets (net assets plus borrowings for investment purposes) in private credit investments (bonds and other credit instruments that are issued in private offerings or issuedbyprivate companies). This investment involves a high degree of risk. You should purchase these securities only if you can afford the complete loss of your investment. You should read the prospectus carefully for a description of the risks associated with an investment in HLEND. These risks include, but are not limited to,the following: • We have limited operating history and there is no assurance that we will achieve our investment objectives. • This is a “blind pool” offering and thus you will not have the opportunity to evaluate our investments before we make them. • You should not expect to be able to sell your shares regardless of how we perform. • You should consider that you may not have access to the money you invest for an extended period of time. • We do not intend to list our shares on any securities exchange, and we do not expect a secondary market in our shares to develop prior to any listing. • Becauseyoumaybeunabletosell yourshares, youwill beunable to reduce your exposure in any market downturn. • We intend to implement a share repurchase program, but only a limited number of shares will be eligible for repurchase and repurchases will be subject to available liquidity and other significant restrictions. • An investment in our Common Shares is not suitable for you if you need access to the money you invest. See “Suitability Standards” and “Share Repurchase Program” in the prospectus. • We cannot guarantee that we will make distributions, and if we do, we may fund such distributions from sources other than cash flow from operations, including, without limitation, the sale of assets, borrowings, return of capital or offering proceeds, and we have no limits on the amounts we may pay from such sources. A return of capital (1) is a return of the original amount invested, (2) does not constitute earnings or profits and (3) will have the effect of reducing the basis such that when a shareholder sells its shares the sale may be subject to taxes even if the shares are sold for less than the original purchase price. • Distributions may also be funded in significant part, directly or indirectly, from temporary fee waivers or expense reimbursements borne by HPS or its affiliates, that may be subject to reimbursement to HPS or its affiliates. The repayment of any amounts owed to our affiliates will reduce future distributions to which you would otherwise be entitled. • We expect to use leverage, which will magnify the potential for loss on amounts invested in us. • We qualify as an “emerging growth company” as defined in the Jumpstart Our Business Startups Act and we cannot be certain if the reduced disclosure requirement applicable to emerging growth companies will make our Common Shares less attractive to investors. • We intend to invest primarily in securities that are rated below investment grade by rating agencies or that would be rated below investment grade if they were rated. Below investment grade securities, which are often referred to as “junk,” have predominantly speculative characteristics with respect to the issuer’s capacity to pay interest and repay principal. They may also be illiquid and difficult to value. • We do not own the HPS name, but we are permitted to use it as part of our corporate name pursuant to the investment advisory agreement between HLEND and HPS Investment Partners, LLC (together with its affiliates, “HPS”). Use of the name by other parties or the termination of the use of the HPS name under the investment advisory agreement may harm our business 14
Important Disclosure Information (Cont’d) Neither the Securities and Exchange Commission nor any state securities regulator has approved or disapproved of these securities or determined if this prospectus is truthful or complete. Any reference to the contrary is a criminal offense. This material must be read in conjunction with the HLEND prospectus in order to fully understand all the implications and risks of an investment in HLEND. This material is neither an offer to sell nor a solicitation of an offer to buy securities. An offering is made only under HLEND’s registration statement filed with the Securities Exchange Commission and only by means of the prospectus, which must be made available to you prior to making a purchase of shares. Investors are advised to carefully consider the investment objectives, risks and charges and expenses of HLEND before investing. A copy of the prospectus containing this and other information about HLEND and can be obtained from the SEC’s website at http://www.sec.gov and at www.HLEND.com. You are advised to obtain a copy of the prospectus and to carefully review the information contained or incorporated by reference therein before making any investment decision, includingthe “Risk Factors” section therein, which contains a discussion of the risks and uncertainties that we believe are material to our business, operating results, prospects and financial condition. At this time, the information in the prospectus (or Statement of Additional Information) is not complete and may be changed. Limited Operating History. The Fund is a non-diversified, closed-end management investment company that has elected to be regulated as a BDC with limited operating history. As a result, prospective investors have limited track record or history on which to base their investment decision. There can be no assurance that the results achieved by similar strategies managed by HPS or its affiliates will be achieved for the Fund. Past performance should not be relied upon as an indication of future results. Moreover, the Fund is subject to all of the business risks and uncertainties associated with any new business, including the risk that it will not achieve its investment objective and that the value of an investor’s investment could decline substantially or that the investor will suffer a complete loss of its investment in the Fund. The Adviser and the members of the Investment Team have no prior experience managing a BDC, and the investment philosophy and techniques used by the Adviser to manage a BDC may differ from the investment philosophy and techniques previously employed by the Adviser, its affiliates, and the members of the Investment Team in identifying and managing past investments. In addition, the 1940 Act and the Code impose numerous constraints on the operations of BDCs and RICs thatdonot apply to the other types of investment vehicles. For example, under the 1940 Act, BDCs are required to invest at least 70% of their total assets primarily in securities of qualifying U.S. private companies or thinly traded public companies, cash, cash equivalents, U.S. government securities and other high-quality debt investments that mature in one year or less from the time of investment. The Adviser’s and the members of the Investment Team’s limited experience in managing a portfolio of assets under such constraints may hinder their respective ability to take advantage of attractive investment opportunities and, as a result, achieve the Fund’s investment objective. Numerical data is approximate and as of September 30, 2022, unless otherwise noted. Thewords “we,”“us”and “our”refer to HLEND, unless thecontext requires otherwise. ForwardLookingStatementDisclosure Certain information contained in this document constitutes “forward looking statements,” which can be identified by the use of forward looking terminology such as “may,” “will,” “expect,” “ intend,” “anticipate,” “estimate,” “believe,” “continue” or other similar words, or the negatives thereof. These may include our financial projections and estimates and their underlying assumptions, statements about plans, objectives and expectations with respect to future operations, and statements regarding future performance. Such forward-looking statements are inherently uncertain and there are or may be important factors that could cause actual outcomes or results to differ materially from those indicated in such statements. HLEND believes these factors include but are not limited to those described under the section entitled “Risk Factors” in its prospectus and any such updated factors included in its periodic filings with the Securities and Exchange Commission (the “SEC”) which will be accessible on the SEC's website at www.sec.gov. These factors should not be construed as exhaustive and should be read in conjunction with the other cautionary statements that are included in HLEND’s prospectus and other filings. 15
Important Disclosure Information (Cont’d) Except as otherwise required by federal securities laws, we undertake no obligation to publicly update or revise any forward-looking statements, whether as a result of new information, future developments or otherwise. AdditionalImportantDisclosures This material was not created by any third party registered broker dealers or investment advisers who are distributing shares of HLEND (each a “Dealer”). The Dealers are not affiliated with HLEND and have not prepared the material or the information herein. Investments mentioned may not be suitable for all investors. Any product discussed herein may be purchased only after an investor has carefully reviewed the prospectus and executed the subscription documents. Alternative investments often are speculative, typically have higher fees than traditional investments, often include a high degree of risk and are suitable only for eligible, long-term investors who are willing to forgo liquidity and put capital at risk for an indefinite period of time. They may be highly illiquid and can engage in leverage and other speculative practices that may increase volatility and risk of loss. Opinions expressed herein reflect the current opinions of HPS as of the date appearing in the materials only and are based on HPS’s opinions of the current market environment, which is subject to change. Stockholders, financial professionals and prospective investors should not rely solely upon the information presented when making an investment decision and should review the most recent prospectus, as supplemented, available at www.sec.gov or www.HLEND.com. Certain information contained in the materials discusses general market activity, industry or sector trends, or other broad based economic, market or political conditions and should not be construed as research or investment advice. Further, opinions expressed herein may differ from the opinions expressed by a Dealer and/or other businesses affiliates of a Dealer. This is not a “research report” as defined by FINRA Rule 2241 and was not prepared by the research departments of a Dealer or its affiliates. Past performance is not a guarantee of future results. Actual results may vary. Diversification of an investor’s portfolio does not assure a profit or protect against loss in a declining market. Alternative investments may involve complex tax structures, tax inefficient investing and delays in distributing important tax information. Individual funds have specific risks related to their investment programs that will vary from fund to fund. Prospective investors in HLEND should carefully read HLEND's prospectus for more information. HLEND does not provide any tax or legal advice and none of the data provided herein should be construed as investment, tax, accountingorlegal advice. Prospective investors should consult their own tax, legal and accounting advisors with respect to the tax consequences to them of investing in HLEND in light of their particular circumstances. Interests in alternative investment products are distributed by the applicable Dealer and (1) are not FDIC insured, (2) are not deposits or other obligations of such Dealer or any of its affiliates, and (3) are not guaranteed by such Dealer and its affiliates. Each Dealer is a registered broker dealer or investment adviser, not a bank. 16
Important Disclosure Information (Cont’d) Certain countries have been susceptible to epidemics or pandemics, most recently COVID 19. The outbreak of such epidemics or pandemics, together withany resulting restrictions on travel or quarantines imposed, could have a negative impact on the economy and business activity globally (including in the countries in which HLEND invests), and thereby could adversely affect the performance of HLEND’s investments. Furthermore, the rapid development of epidemics or pandemics could preclude prediction as to their ultimate adverse impact on economic and market conditions, and, as a result, present material uncertainty and risk with respect to HLEND and the performance of its investments or operations. The contents of this communication: (i) do not constitute an offer of securities or a solicitation of an offer to buy securities, (ii) offers can be made only by the respective offering documents which are available upon request, (iii) do not and cannot replace the offering documents and is qualified in its entirety by the offering documents, and (iv) may not be relied upon in making an investment decision related to any investment offering by the issuer of the securities, or any affiliate, or partner thereof ( Issuer ). All potential investors must read the offering documents and no person may invest without acknowledging receipt and complete review of the offering documents. With respect to any “targeted” goals outlined herein, these do not constitute a promise of performance, nor is there any assurance that the investment objectives of any program will be attained. All investments carry the risk of loss of some or all of the principal invested. These “targeted” factors are based upon reasonable assumptions more fully outlined in the offering documents for the respective investment opportunity. Consult the offering documents for investment conditions, risk factors, minimum requirements, fees and expenses and other pertinent information with respect to any investment. Past performanceis no guarantee of future results. All information is subject to change. You should always consult a tax and/or finance professional prior to investing. Issuer does not warrant the accuracy or completeness of the information contained herein. Thank you for your cooperation. Securities offered through Emerson Equity LLC Member: FINRA/SIPC. Only available in states where Emerson Equity LLC is registered. Emerson Equity LLC is not affiliated with any other entities identified in this communication. 17